Scientific project
Your aim is to create a scientific poster which showcases bird diversity in a park or bushland area of your choice. This will involve conducting fieldwork, interpreting the data you collected and making suggestions of how the area could be improved to cater for a wider range of birds.
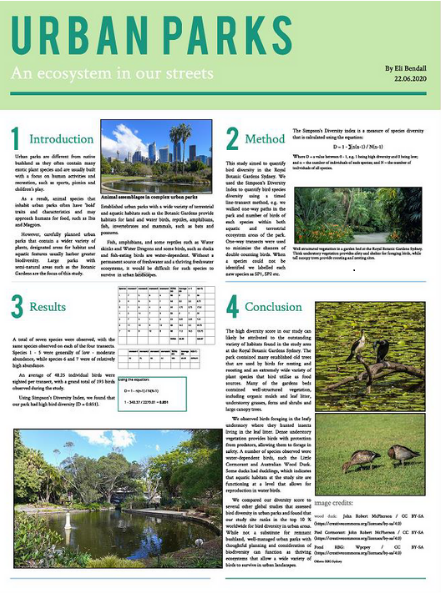
Urban Parks poster
Data Analysis
Use this Data Analysis sheet (PDF 80KB) to calculate ‘Simpson’s Diversity Index’. This is a measure of the diversity in an area. You could set this up on an Excel document to make the calculations quicker.
Create a graph using this data.
Poster Presentation
Create a free poster-making account at www.lucidpress.com Enter your email and sign up. Follow the instructions and activate your membership. Be sure to choose the ‘free’ account type.
Access your account on the webpage. Enter your new details to enter the webpage. Ignore any advertisements for upgrading your account. You only want the free account.
On your homepage, navigate to the ‘posters’ section.
Choose poster design. While there are many options for posters here, we only want you to choose from three specific styles: (1) “Earth- Science Fair Project”; (2) “Ecosystem”; or (3) “Forests”.
Fill in your content on the Poster Creation Wizard. Click on the existing text boxes and shapes and replace them with your own text & images. Use the sidebar (right-hand side) to edit colours, font etc. Use the table tool to create a results table or import your own table or graphs from MS Word or Excel.
Click ‘file’ and then ‘save’ your poster after giving the file a name.
Download your poster by clicking on download which brings up the sidebar. Your poster can now be emailed or printed.