Interdependent ecosystems
A collection of organisms of different species that live together in the same place and time can be called an ecosystem. It is a ‘system’ because if one component of the system fails, it has an effect on all other parts.
For example, fungi play a key role in nutrient recycling and decomposition, giving seedlings the resources they need to grow into trees. Trees provide food for animals in the form of leaves and nectar.
As trees age they can form hollows, where animals can live and when branches drop, they become ground-dwelling shelters for mammals, reptiles and invertebrates. Without the invertebrates, the reptiles would not have a reliable food source and without the reptiles, the resident Kookaburra wouldn’t get the meaty nutrition it needs to survive and reproduce.
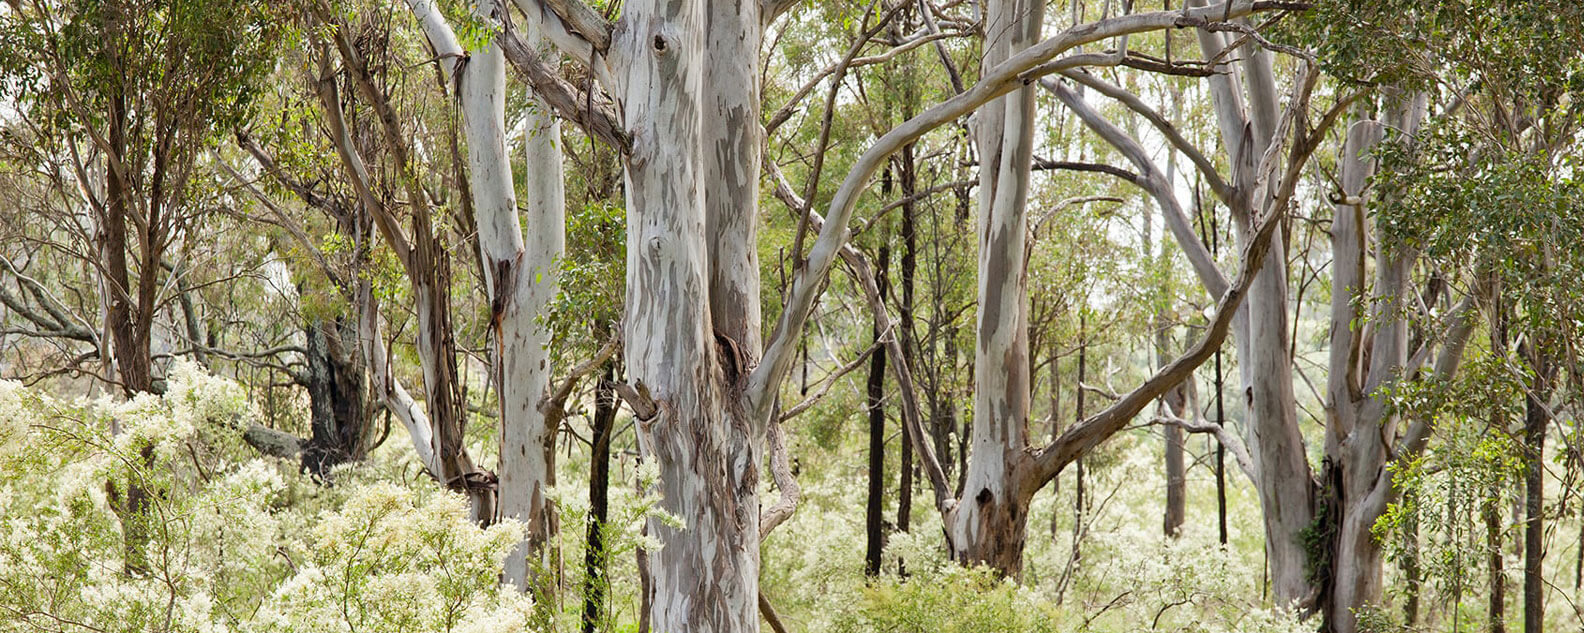
There are many ways to imagine and connect the dots within ecosystems, and the relationships vary widely depending on the environment. For example, a rockpool and a forest are very different to look at but are nonetheless full of organisms that are dependent on each other.
Birds are one of the more easily visible components of an ecosystem. Measuring species diversity and abundance in birds gives us an idea of how well an ecosystem is doing with regard to the provision of different types of habitat and what resources are available.
For example, small perching birds such as wrens and robins need an adequate amount of shrubs and grasses to protect them from predators while nesting and foraging. Semi-aquatic birds such as cormorants, darters and spoonbills need relatively large and healthy aquatic ecosystems with sufficient areas for perching, nesting and basking.
Watch the Ecosystem Basics! video to get you started in your understanding of ecosystems.
Ecosystems Episode 1: What is an ecosystem?
Activity: Bird survey and poster presentation
Design a field survey, collect data to analyse, and then create a scientific poster showcasing bird diversity in your local park, garden or bushland.
Introduction
Your aim is to create a scientific poster which showcases bird diversity in a park or bushland area of your choice. This will involve conducting fieldwork, interpeting the data you collected and making suggestions of how the area could be improved to cater for a wider range of birds.
Materials and resources
- computer, internet access and email account
- Australian Birds App
- data sheet (PDF, 26 KB)
- data analysis sheet (PDF, 77 KB)
- clipboard, pen, timer/clock, binoculars (optional)
- hat, sunscreen, water and phone in case of emergency
Field work
- Select a local park, large garden or bushland area.
- Download the free Aust. Birds field guide app (Galexy Pty. Limited) for Apple or Android. This app makes bird identification simple. Just click through the images which look most like your bird until you find the correct species.
- Plan your survey. Choose at least two non-overlapping walking routes within your study area. These will become your transect areas. Use Google Maps or Google Earth to help if needed. Consider the time of day. Many birds are most active in the morning or late afternoon.
- Print out your data sheet (PDF, 26 KB) to take on your field work.
- Conduct a bird survey within the study area. To do this you will need to:
- Start a timer to time how long you spend recording your birds on your transect walk.
- Walk very quietly along your 1st transect and count all the birds you see. Record them on your data sheet as their name (if you know) or 'species 1' and a description etc. You can use the app to help identify them as you go.
- Take photos of the different ecosystems within your transect area and any birds you see (be careful not to scare them off).
- Repeat for your 2nd transect making sure you spend the same amount of time recording.
Data analysis
- Use the data analysis sheet (PDF, 77 KB) to calculate 'Simpson's Diversity Index'. This is a measure of the diversity in an area. You could set this up on an Excel document to make the calculations quicker.
- Create a graph using this data.
Poster presentation
- Create a free poster making account at marq.com. Enter your email and sign up. Follow the instructions and activate your membership. Be sure to choose the ‘free’ account type.
- Access your account on the webpage. Enter your new details to enter the webpage. Ignore any advertisements for upgrading your account. You only want the free account.
- On your homepage, navigate to the ‘posters’ section.
- Choose poster design. While there are many options for posters here, we only want you to choose from three specific styles: (1) “Earth- Science Fair Project”; (2) “Ecosystem”; or (3) “Forests”.
- Fill in your content on the Poster Creation Wizard. Click on the existing text boxes and shapes and replace with your own text and images. Use the side-bar (right-hand side) to edit colours, font etc. Use the table tool to create a results table or import your own table or graphs from Word or Excel.
- Click 'file' then 'save' your poster after giving the file a name.
- Download your poster by clicking on download which brings up the side bar. Your poster can now be emailed or printed.